Suborbital Reports User Guide
Introduction
Suborbital Reports is an application which daily downloads sales reports from iTunes Connect and displays the data graphically and offers some analytics features like averages, predictions, geographical reports.
In this guide you'll learn how to use Suborbital Reports and how to interpret the data it generates.
Getting Started
Yes, no one reads manuals. That's why we start this guide with a short step-by-step "getting started" tutorial.
- Start Suborbital Reports
- Add an account (either by clicking "YES" in the dialog which asks you to add an account or going to Preferences -> Accounts).
- In the "Add Account" dialog fill out your username/password and then select "Retrieve …" from the Vendor ID popup button.
- If you provided the correct credentials and got a valid vendor ID you're good to go. Click OK and after a short credential login test the dialog will close.
- Now press the "Update" button and get yourself a coffee. The first data download will take about 10 minutes. (Sorry about that but it's a lot of data to fetch). Subsequent updates of course will take less time.
- After the update went through you can start exploring the app or continue with this guide ;)
The Main Window
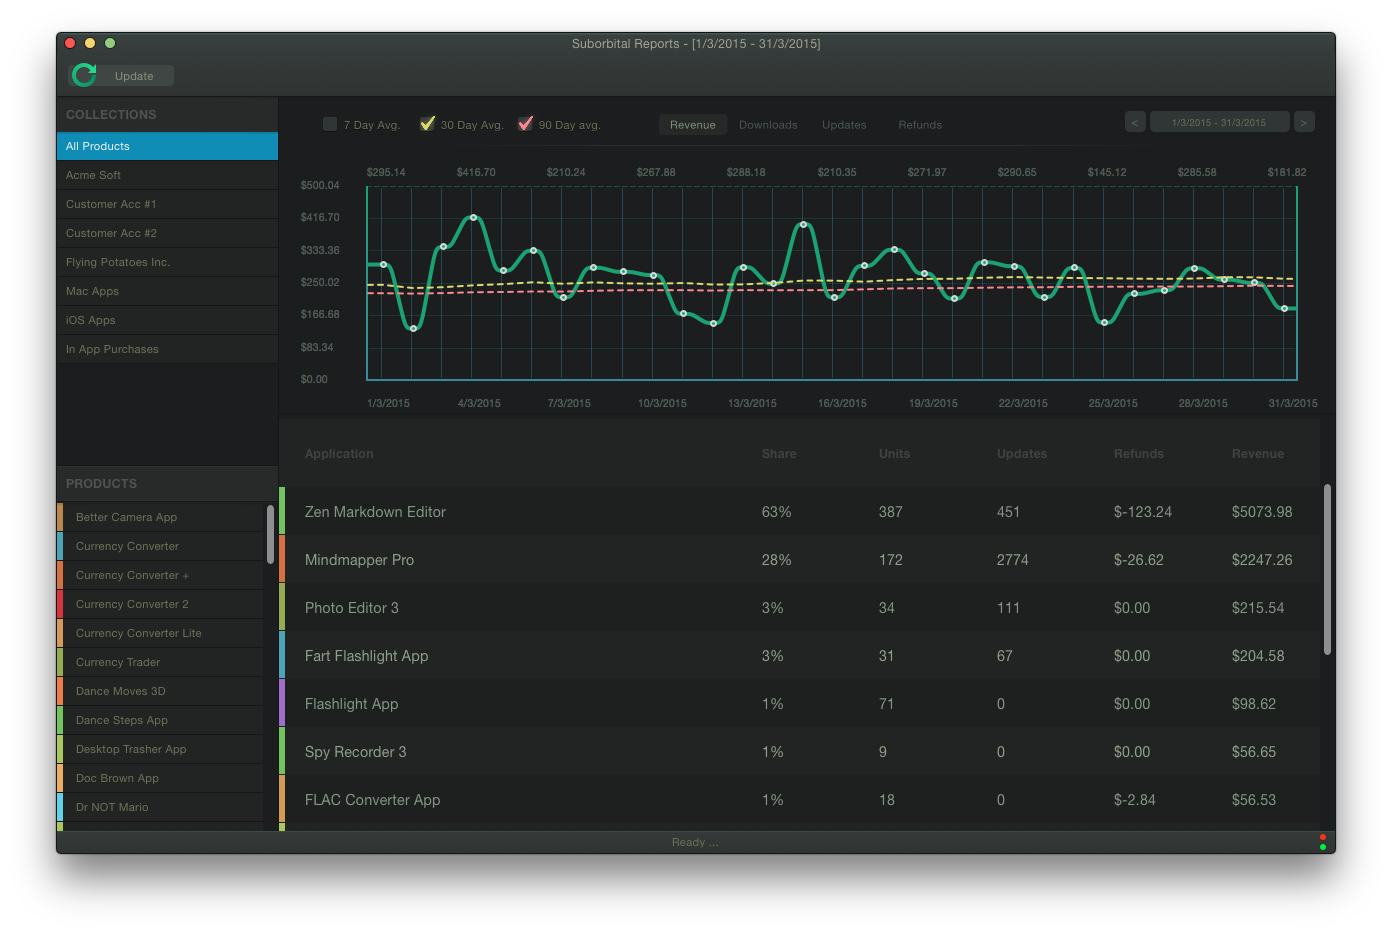
When using Suborbital Reports you will spend most of the time here. In this window all information and data that Suborbital Reports generates flow together and can be easily accessed.
Collections and Products
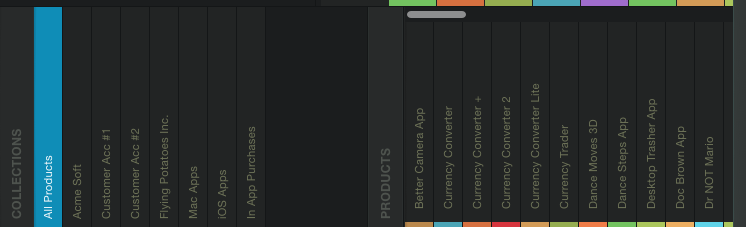
To the left we have the Collections list with the Products list below. Whenever you click on a category or a product those will get selected and data relevant to that selection will be displayed in the right half of the window. By holding the CMD/Shift key while clicking you can add or remove products/categories from your selection.
Categories are a way to group some of your apps by context. For example the "Mac Apps" category will contain only Mac applications. The "All Products" category just selects all applications in the database. You will also find categories named after your ITC accounts. Selecting one of those categories will display only apps belonging to that account.
The Product list is pretty straight forward as it allows the selection of single (or multiple) products for further analysis. The list's contents are determined by the Category list's selection. You will notice that next to the products there are distinctive colors. Those colors are unique for each application and correlate with the colors found in the "bar graph" and "the numeric list view".
Graph Area
The graph area in the Window's right half graphically displays sales data for the currently selected applications. Depending on the selected date range the graph can take on three visually distinctive modes: "Bar Graph", "Smooth Line Graph", "Jagged Line Graph".
You can click (or drag select) in the graph area to select a subset of dates for further analysis. Doing so will affect what data is displayed in the "numeric list view". (Pressing CMD-D will clear any selection).
Bar Graph
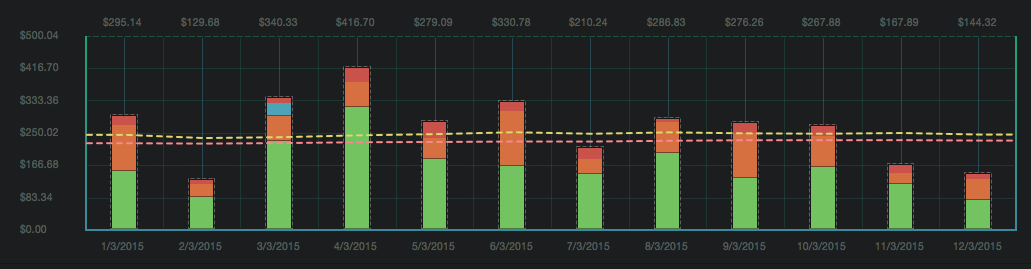
The bar graph is the most informative mode but as it takes quiet a lot of space to display correctly it can contain 14 bars at most. So if the selected time range is longer than approximately two weeks one of the line graphs gets displayed instead.
The different colors in a bar correspond to application colors from the products list. Each color also correspond to the application's share of the total revenue/downloaded units that day. So a 50% blue bar graph means that the application whose color is blue generated 50% of the day's total revenue.
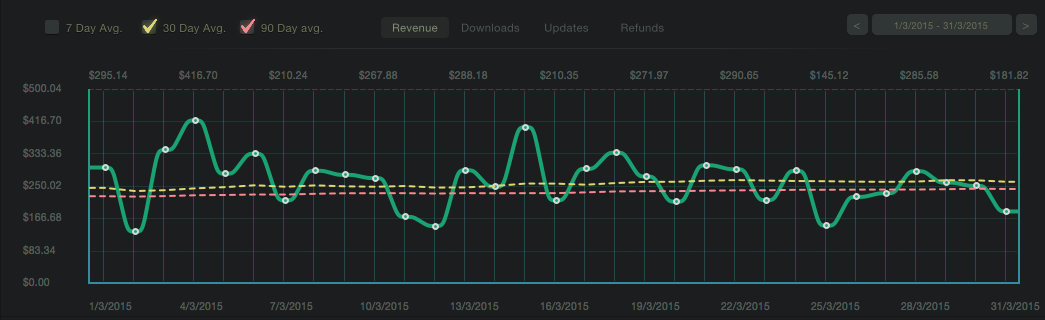
Smooth Line Graph
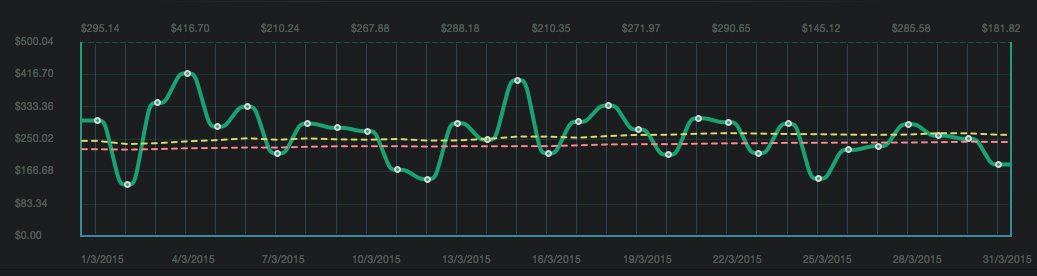
The smooth line graph is displayed when the selected date range is longer than 14 days but shorter than 33 days. It's a simple line graph that just looks pretty. So there's not much to say about its meaning.
Jagged Line Graph
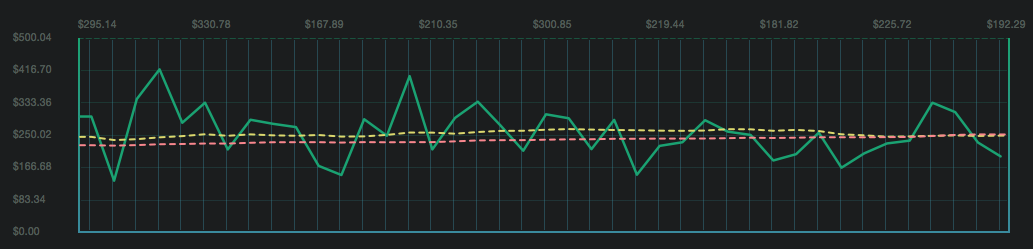
If you select a date range longer than 33 days you will get this graph. For drawing performance reasons it has no smooth curves and, just like the smooth line graph, correlates with the revenue/downloaded units/etc.
Averages
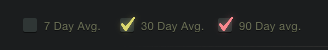
To the left-top of the graph area there are three check boxes. Selecting each box will display the corresponding moving average in the graph view. The moving average will have the same color as the checkbox's checkmark.
Data Display Mode
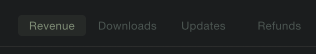
In the center-top of the graph area there are 4 segment buttons. Each button will change what data is rendered in the graph area. The default is "Revenue" which displays the sales revenues by day. "Downloads" will display the count of downloaded units (both free and paid), "Updates" will display the downloaded units which were updates and "Refunds" will display the monetary value of refunds issued.
Date Range Selector
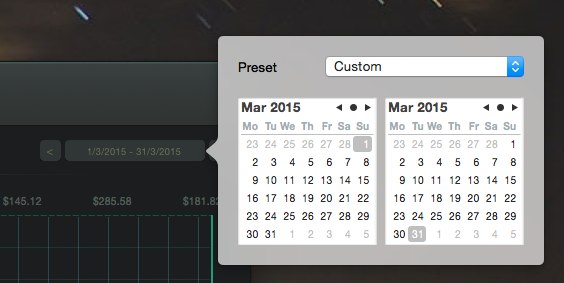
In the top-right corner of the graph area there is a drop down which lets you specify which date range to analyze. Clicking on this drop down will show a popup containing two calendar views (for start and end date) and a presets drop down with a few sensible date range presets.
Numeric List views
Averages & Predictions
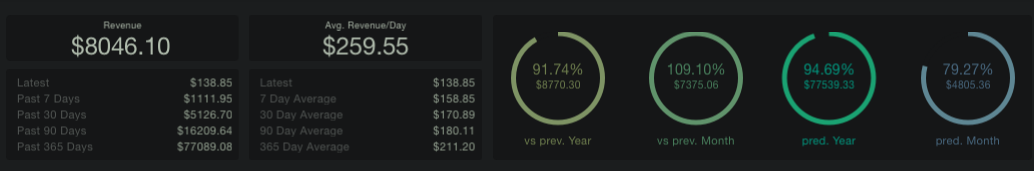
To the left of this area in the first column you can see a summary of how much revenue was generated by the selected applications over different time ranges. The second column displays the rolling average taken of different time ranges. "109% vs prev. year" for example means that you generated 109% revenues of what you did in the same time of year the previous year. The number below the percentage shows the absolute revenue generated in the selected time frame one year ago.
The right half of the view contains circular views of which the first two display how you're doing vs. the previous year and previous month. The two rightmost circle views show monthly/yearly revenue predictions based on the current revenue and rolling averages.
Numerical List View
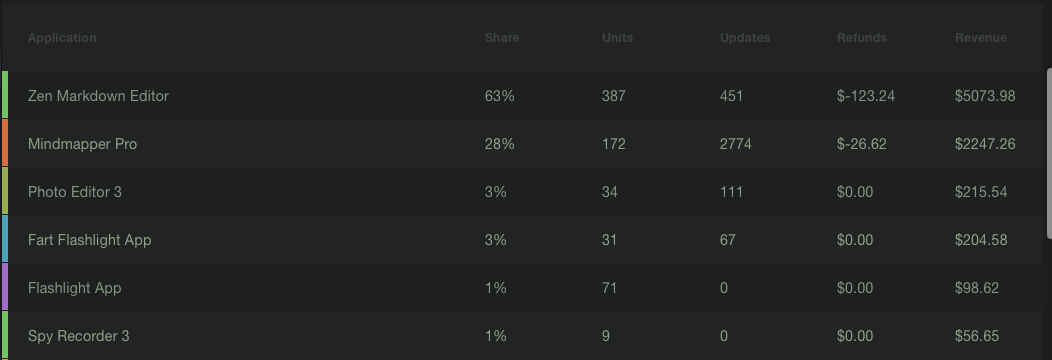
This is the numerical representation of the graph area. The labels should be self explanatory. As with a standard list view you can click on the headers to sort the view by category.
Clicking on the list view itself will spawn a Geo Report window. This geo report window is still only a beta/placeholder and will be replaced by a proper Geo Report view in the near future. It was only considered too important to be left out from the initial release :)
The Preferences Dialog
General Pane
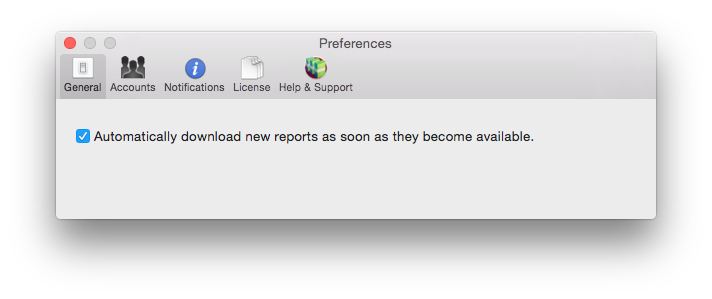
If you select the only checkbox in this pane then Suborbital Reports will regularly check for new reports. This happens around once every five minutes until new reports are found and downloaded. After that this function stops polling servers and waits till the next day.
Accounts Pane
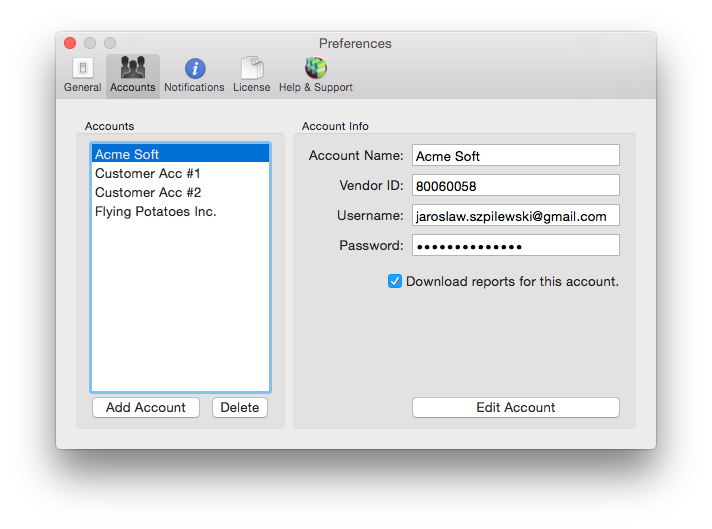
Here you can manage your iTunes Connect accounts. The list view to the left provides a list of accounts you have added to Suborbital Reports. Pressing "Add Account" will open the "Add Account Dialog" (see next section). Pressing "Delete" will delete the account and remove all its associated data from the database! Make sure you have a backup of your database as this can not be undone!
On the right side you see a summary of the currently selected account.
If you want to exempt the account from downloading reports uncheck the "Download Reports for this Account" checkbox. Suborbital Reports then won't download new reports for the account. (This is handy if you want to run a read only version of Suborbital Reports and just analyze a database provided by another Mac).
If you want to edit the account's details press press the "Edit Account" button. This will open the "Edit Account Dialog" (see next section).
Add/Edit Account Dialog
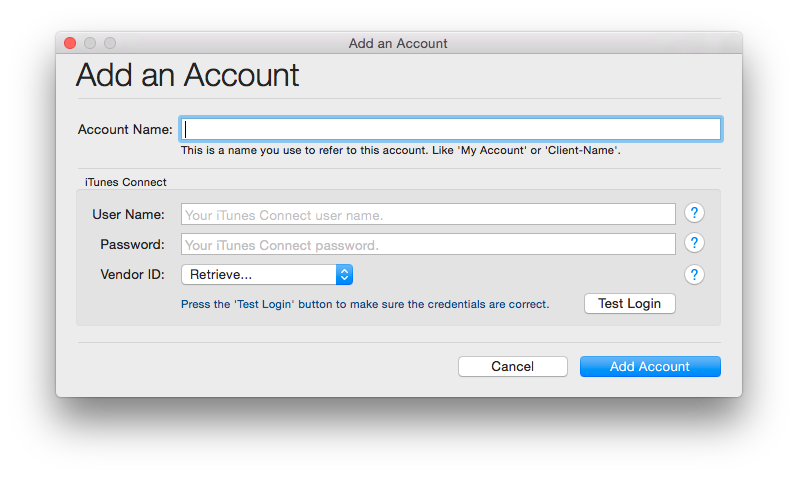
In this dialog you can edit the details of an account (or create a completely new account).
The account name is a name you can freely choose. This name will be displayed whenever Suborbital Reports needs to refer to this account (for example in the Collections list).
User Name is your iTunes Connect username which usually is your Apple ID which usually is an email address.
The Password is your iTunes Connect password.
Once you have provided a valid username/password (you can use the Test Login button to verify anytime) you will need to press the "Retrieve…" item in the Vendor ID popup button. This will query iTunes Connect for your Vendor ID. (In the future iTunes Connect is probably going to support more than one vendor per ITC account so you will have to select the vendor ID you want to fetch data for).
Once you are done press the "Add Account"/"Save Changes" button to write the account data to the database and to close the dialog.
Please not that Suborbtial Reports securely saves your password in the OS X keychain. So if you copy your database to a different Mac you will have to type in the password again (unless keychain sync is active).
Notifications Pane
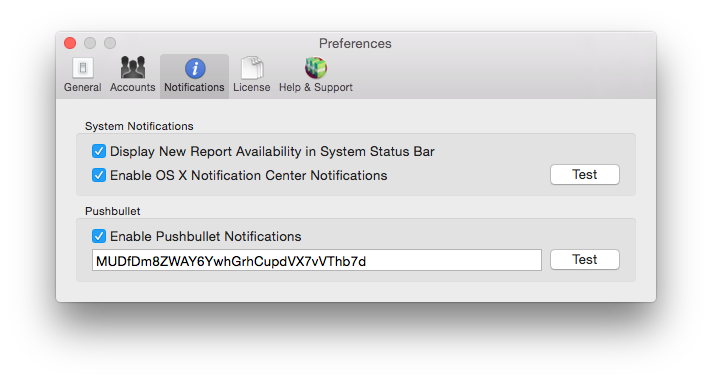
The first check box titled "Display New Report Availability in System Status Bar" controls the option to display the "empty/full Star" icon in System Item area of the Menu Bar. If you don't need visual clues about the status of yesterday's reports you can uncheck this box.
"Enable OS X Notifications" determines if Suborbital Report will show an OS X notification whenever new reports have been downloaded. The notification will include a short summary of the most recent revenue numbers.
The next checkbox and text field are used to control Pushbullet support. If you provide a Pushbullet API key and check the "Enable Pushbullet Notifications" box Suborbital Reports will send a Pushbullet notification to the Devices associated with the API key whenever new reports have been downloaded. The notification will include a short summary of the most recent revenue numbers.
License Pane
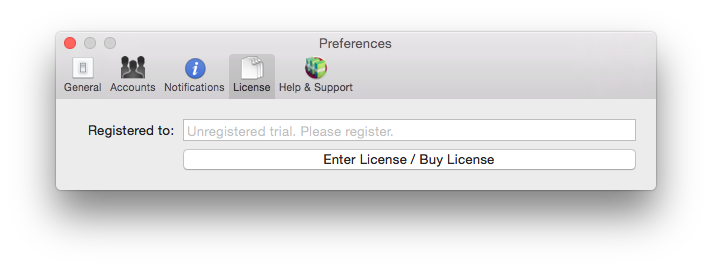
If you are running a registered copy of Suborbital Reports the "Registered to:" field will contain your name and the button below it can be used to deactivate the license on the current machine and revert Suborbital Reports back to trial mode.
If your copy is not registered yet the button below the text field will be labeled "Enter License / Buy License" and by pressing it the purchase/register dialog will pop up. (See next section).
Purchase/Register Dialog
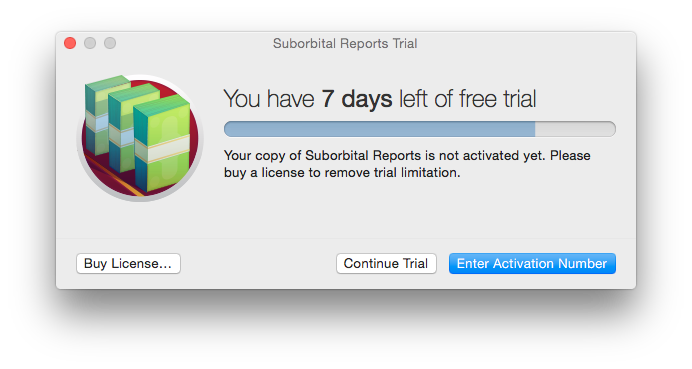
If you already have bought Suborbital Reports and have a Serial Number/Activation ID (starting with 'id') click on the "Enter Activation Number" and enter it into the text field. If the Serial Number is correct Suborbital Reports will disable trial mode and turn into the full version.
If you haven't bought Suborbital Reports yet you can click the "Buy License…" button to open our web store where you can purchase a license. (Payments are handled by Fastspring LLC. and they will issue a proper invoice so you can write off SR as a business expense).
Help & Support Pane
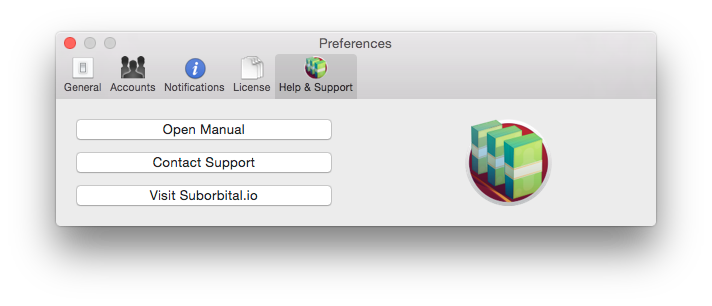
If you're reading this you probably already found out about the "Help & Support" pane. Just click the buttons and find out where they take you ;)
Need more Support?
You can contact us 24 hours a day directly via email support@suborbital.io or visit our support forums.